Raster data
In PostGIS raster data is modelled as large collections of small chunks of data. This means raster data can be manipulated and analyzed in much the same way as vector data.
Note
At PostGIS 2.0, raster support in PostGIS is provided primarily to support analysis, not visualization.
Joining raster and vector data
Integrated raster and vector analysis is provides a powerful additional tool for data analysts. In the following example, a raster elevation dataset is joined to vector land use dataset to highlight areas unsuitable for certain types of agriculture.
CREATE TABLE steep_logging AS
WITH
counts AS (
 SELECT
   btm.gid,
   ST_SummaryStats(ST_Clip(rast, geom)) AS stats
 FROM slope, btm
 WHERE
   ST_Intersects(geom, ST_ConvexHull(rast))
 AND
   btm.plu_label = 'Recently Logged';
There are many functions in PostGIS for handling raster data, for example ST_AsRaster(), ST_MakeEmptyRaster(), ST_AsTIFF(). For a full list of functions, refer to Raster Reference.
Raster_columns view
The raster_columns database view catalogs all the table columns in your PostGIS database that are of type raster. As the view takes advantage the constraints on the base tables, the information in the catalog is always current and consistent with the state of the database.
Note
If you didn’t create your raster table using raster2pgsql, or forgot to specify the -C flag (apply raster constraints) during the load operation, you can still apply those constraints with AddRasterConstraints() to ensure the relevant information about your raster data is registered correctly.
The attributes of the raster_columns view are:
r_table_catalog,r_table_schema,r_table_name—Fully qualified name of the raster tabler_raster_column—Name of the raster columnsrid—Spatial reference identifier in thespatial_ref_systablescale_x,scale_y—Scaling between geometric spatial coordinates and pixelblocksize_x—Width (number of pixels across) of each raster tileblocksize_y—Width (number of pixels down) of each raster tilesame_alignment—Boolean value indicating if all tiles have the same alignmentregular_blocking—True/False constraint indicating if tiles overlap, are of the same alignment, pixel size and so onnum_bands—Number of bands per tile in the raster datapixel_types—Array defining pixel type for each bandnodata_values—Array denoting thenodata_valuefor each bandout_db—Indicates if the raster data is maintained outside the database (for example in GeoTIFF files)extent—Extent of all rows in your raster data
Raster overviews
A raster overview is a lower resolution version of a base raster table, used primarily to improve display performance for operations that do not require pixel level information. At each higher level of overview, the data is re-sampled to provide a representation of the data at a lower spatial resolution.
Since there are fewer records to process in an overview, and each overview pixel covers a geographically larger extent, overview processing operations are generally faster. However, the results are not as accurate as the results derived from the higher resolution base raster table.
If the -l option is included with the raster data loader tool raster2pgsql, an overview will be computed and created for each image loaded. To create more than one overview table per base raster table, separate each overview level with a comma (,). For example:
raster2pgsql -s 4236 -I -C -l 2,3 -M *.tif -F -t 100x100 public.demelevation | psql -d gisdb -h localhost -p 5432
Note
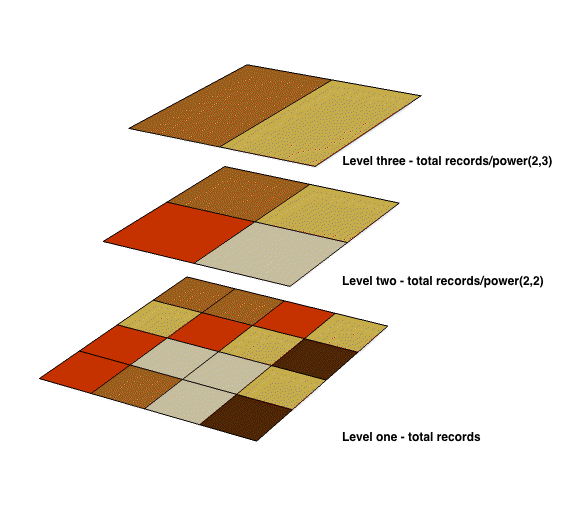
Each overview tile generated by raster2pgsql has the same number of pixels as its parent, but is of a lower resolution where each overview pixel represents (Power(2,overview_factor) pixels of the original).
Overview table names follow the convention o_<overview_level>_<raster_table_name>. For example:
o_2_myRastTable
Level one overviews always represent the original raster data. Level two overviews will represent each tile in the raster object with four times fewer pixels. For example, if you have a folder of 5000x5000 pixel image files that you chose to chunk 125x125, each image file your base raster table will have (5000*5000)/(125*125) = 1600 records. Your level two overview will have 1600/Power(2,2) = 400 rows, your level three overview will 1600/Power(2,3) = 200 rows, and so on.
Note
If the pixels in your raster data aren’t divisible by the size of your tiles, some scrap tiles (tiles not completely filled) will remain.

Reduced resolution raster overviews
Raster_overviews catalog
The raster_overviews database view catalogs the raster columns used to create raster overviews. The attributes of the raster_overviews view are:
o_table_catalog,o_table_schema,o_table_name—Fully qualified name of the raster overview tableo_raster_column—Name of the raster column in the overview tabler_table_catalog,r_table_schema,r_table_name—Fully qualified name of the base raster tabler_raster_column—Name of the raster column in the base raster table

raster_overviews view
The information in raster_overviews does not duplicate the information in raster_columns. If you require information about an overview table recorded in raster_columns, join the raster_overviews and raster_columns views. For example:
SELECT o.o_table_name, c.r_table_name, c.r_raster_column, c.srid, c.blocksize_x,
  c.blocksize_y, c.num_bands
FROM raster_overviews o, raster_columns c
WHERE o.o_table_name = 'o_3_mytable' AND o.o_table_name = c.r_table_name;
 o_table_name  | r_table_name    | srid | blocksize_x | blocksize_y | num_bands
---------------+-----------------+------+-------------+-------------+-----------
 o_3_mytable   | o_3_mytable     | 4326 | 1155        |  1106       | 3
---------------+-----------------+------+-------------+-------------+-----------
Note
The performance of raster data analysis is sensitive to tile sizes, so you may need to experiment with the optimum tile size settings for your data.