Plugin with action and output
This final example will modify the DrawBox plugin created previously to also display a pop-up window after the box has been drawn on the map.
Open the
DrawBox.jsfile in a text editor.Add an event listener to the
DrawFeaturecontrol to display a pop-up containing the area of the box by replacing the existing control with the following code.control: new OpenLayers.Control.DrawFeature(this.boxLayer, OpenLayers.Handler.RegularPolygon, { handlerOptions: { sides: 4, irregular: true }, eventListeners: { featureadded: this.displayPopup, scope: this } } )
Add the
displayPopupfunction to theDrawBox.jsfile, which will create the output in the form of aGeoExt.Popup. Insert it before theraiseLayerfunction:displayPopup: function(evt) { this.removeOutput(); this.addOutput({ xtype: "gx_popup", title: "Feature info", location: evt.feature, map: this.target.mapPanel, width: 150, height: 75, html: "Area: " + evt.feature.geometry.getArea() }); },
Add the dependency for the
GeoExt.Popupin the top of theDrawBox.jsfile:* @require GeoExt/widgets/Popup.js
Open
app.jsand add anoutputTargetfor theDrawBoxtool, in betweenid: "drawbox",andactionTarget: "map.tbar":}, { ptype: "myapp_drawbox", id: "drawbox", outputTarget: "map", actionTarget: "map.tbar" }, {
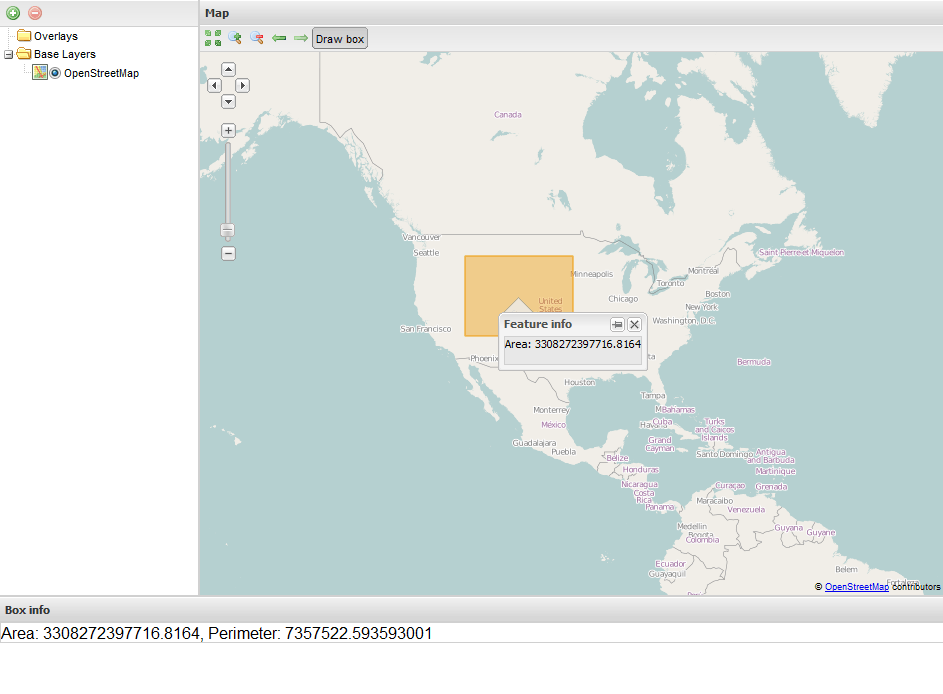
Restart the SDK and reload the application in the browser. Test the functionality by drawing boxes. After drawing a box there will now be a pop-up window at the feature’s location containing the area of the box drawn. The units are in square meters, as the geometry is using Google Web Mercator projection.

Popup showing area of drawn box
Download the DrawBox.js and app.js files created in this section. If you also download BoxInfo.js from the previous section, you will have all the files to recreate this application.